Fig. 10
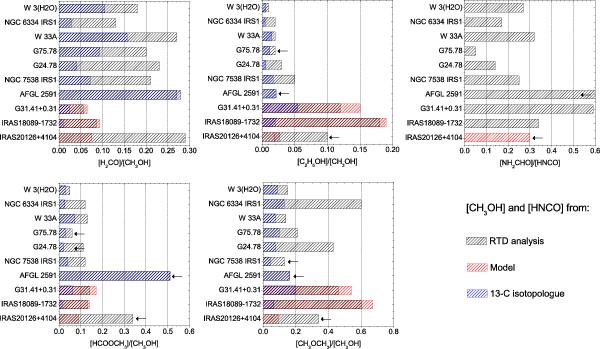
Abundance ratios of complex species with respect to CH3OH for oxygen-bearing species and HNCO for nitrogen-bearing species. The black bars indicate abundance ratios calculated with the CH3OH and HNCO column density derived from the RTD analysis similar to BIS07. The red and blue bars indicate abundance ratios where CH3OH and HNCO column densities are derived from CASSIS or Weeds (HNCO) model, respectively. Upper limits are marked with arrows.
Current usage metrics show cumulative count of Article Views (full-text article views including HTML views, PDF and ePub downloads, according to the available data) and Abstracts Views on Vision4Press platform.
Data correspond to usage on the plateform after 2015. The current usage metrics is available 48-96 hours after online publication and is updated daily on week days.
Initial download of the metrics may take a while.