Fig. 1
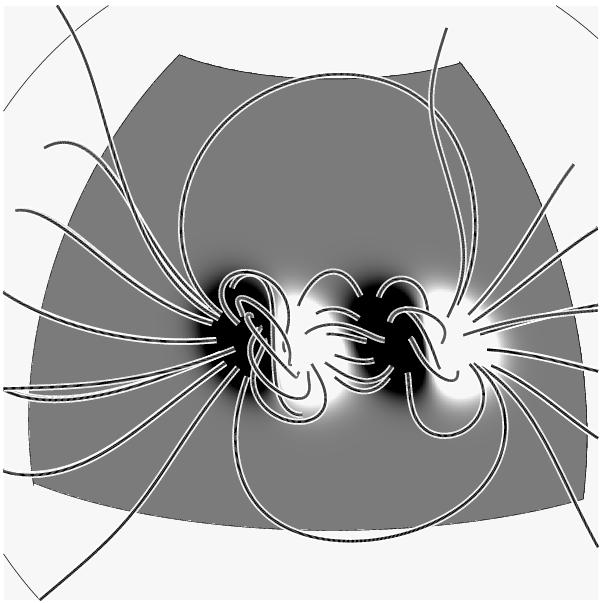
Configuration of the magnetic field after 19 days of evolution using the model of Mackay & van Ballegooijen (2006a). The figure shows a sample of magnetic field lines that illustrate the structure of the magnetic bipoles, the overlying arcade, and the newly formed magnetic flux rope along the PIL of the left-hand side bipole. The surface boundary is coloured according to the polarity of the magnetic field: negative polarity is black and positive is white.
Current usage metrics show cumulative count of Article Views (full-text article views including HTML views, PDF and ePub downloads, according to the available data) and Abstracts Views on Vision4Press platform.
Data correspond to usage on the plateform after 2015. The current usage metrics is available 48-96 hours after online publication and is updated daily on week days.
Initial download of the metrics may take a while.