Fig. 10
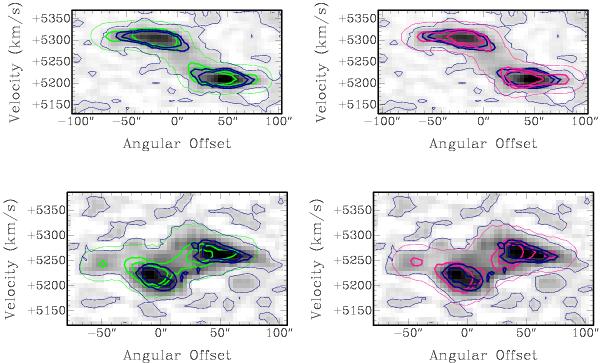
Position-velocity diagrams along major (top) and minor kinematical axes (bottom) of UGC 11919. The blue, pink, and green (black, grey, and light grey in printed version) lines represent the 0.5, 3, and 4 mJy/beam levels of the observed and model data cubes, respectively. Left and right panels correspond to the warped model and the model including non-circular motions, respectively.
Current usage metrics show cumulative count of Article Views (full-text article views including HTML views, PDF and ePub downloads, according to the available data) and Abstracts Views on Vision4Press platform.
Data correspond to usage on the plateform after 2015. The current usage metrics is available 48-96 hours after online publication and is updated daily on week days.
Initial download of the metrics may take a while.