Fig. 7
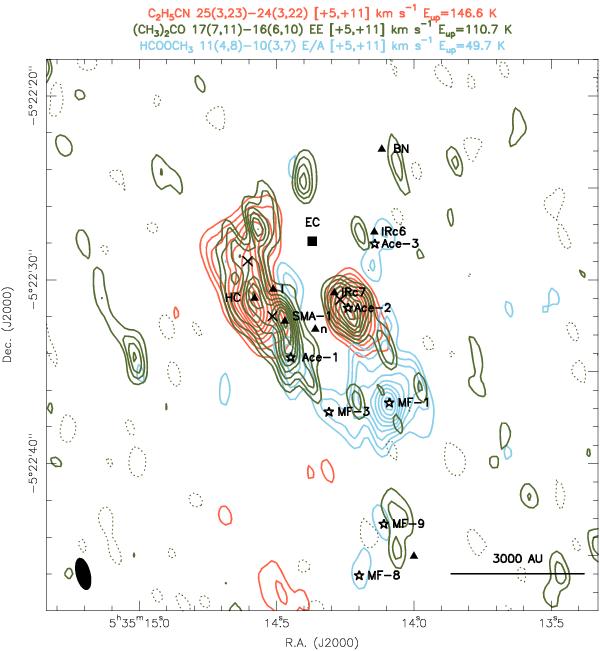
Spatial comparison of C2H5CN, HCOOCH3, and (CH3)2CO emissions with the same resolution ( ) in Orion BN/KL. The C2H5CN 253,23 − 243,22 line at 223 553.6 MHz is shown in light-red contours. The HCOOCH3 114,8 − 103,7 E/A lines at 223 465.3 MHz and 223 500.5 MHz are combined and shown in light-blue contours. The (CH3)2CO 177,11 − 166,10 EE line at 223 775.3 MHz is shown in thick olive contours. Contours run from 15% to 95% in steps of 10% of their peak intensities, and dashed contours represent − 10% of their peak intensities. The black square marks the center of explosion according to Zapata et al. (2009). The positions of source BN, source I, source n, HC, SMA-1, and IRc6/7 are marked as triangles. The positions of acetone emission peaks (Ace-1 to Ace-3) and some of the methyl formate emission peaks (MF-1, MF-3, MF-8, and MF-9) are marked as stars. Black crosses mark the three NH3 column density peaks (also close to the temperature peaks) according to Goddi et al. (2011b).
Current usage metrics show cumulative count of Article Views (full-text article views including HTML views, PDF and ePub downloads, according to the available data) and Abstracts Views on Vision4Press platform.
Data correspond to usage on the plateform after 2015. The current usage metrics is available 48-96 hours after online publication and is updated daily on week days.
Initial download of the metrics may take a while.