Fig. B.2
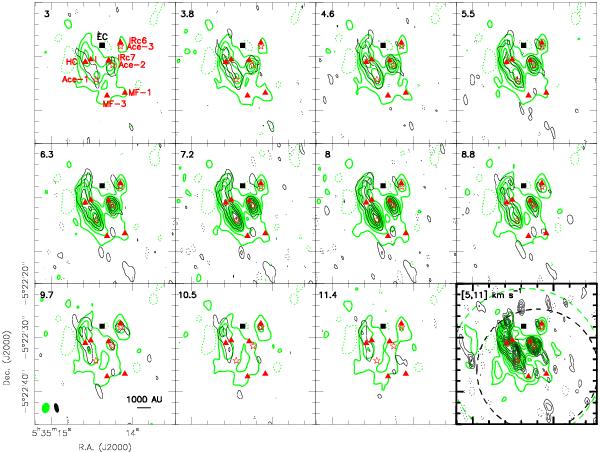
Comparison of the PdBI (black) and ALMA-SV (green) channel maps of the acetone 177,11 − 166,10 EE line (Eup/k = 110.7 K) at 223 775.3 MHz. Contours run from 0.6 to 8.1 K in steps of 0.9 K, and the dashed contours represent –0.6 K. The bottom-right panel shows the integrated intensity (from 5 to 11 km s-1) in contours running from 15% to 95% in steps of 10% of their peak temperatures, and the dashed contours represent –10% of their peak temperatures. The primary beams of the ALMA-SV and PdBI data are indicated. The black square marks the center of explosion according to Zapata et al. (2009). The positions of source BN, HC, IRc6/7, and source I are marked as triangles. The positions of acetone emission peaks (Ace-1 to Ace-3) are marked as stars.
Current usage metrics show cumulative count of Article Views (full-text article views including HTML views, PDF and ePub downloads, according to the available data) and Abstracts Views on Vision4Press platform.
Data correspond to usage on the plateform after 2015. The current usage metrics is available 48-96 hours after online publication and is updated daily on week days.
Initial download of the metrics may take a while.