Fig. A.2
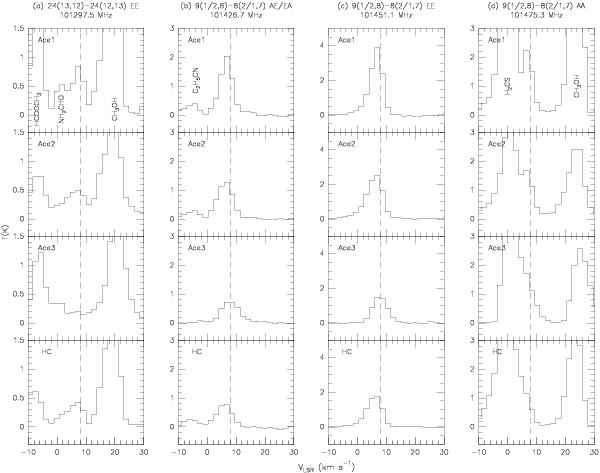
(CH3)2CO spectra near 101 GHz toward four positions (three acetone emission peaks and HC) in the Orion BN/KL region. b)−c) Spectra correspond to the channel maps shown in Fig. 1 at 101 427 MHz and 101 451 MHz, respectively. Dashed lines indicate the VLSR of 8 km s-1 and correspond to the (CH3)2CO line shown at the top of each panel.
Current usage metrics show cumulative count of Article Views (full-text article views including HTML views, PDF and ePub downloads, according to the available data) and Abstracts Views on Vision4Press platform.
Data correspond to usage on the plateform after 2015. The current usage metrics is available 48-96 hours after online publication and is updated daily on week days.
Initial download of the metrics may take a while.