Free Access
Fig. A.1
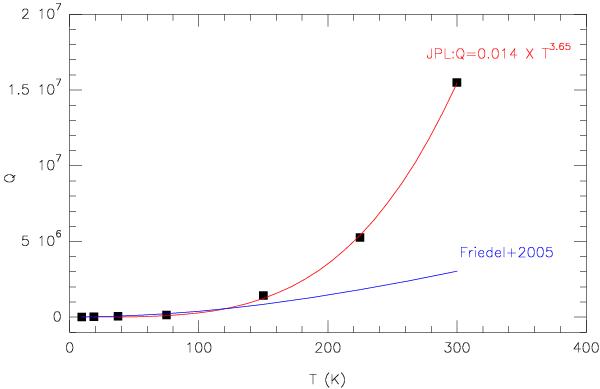
Comparison of the acetone partition functions taken from the JPL database (black squares) and the approximation (blue curve) used by Friedel et al. (2005). The red curve is a fit to the JPL acetone partition functions.
Current usage metrics show cumulative count of Article Views (full-text article views including HTML views, PDF and ePub downloads, according to the available data) and Abstracts Views on Vision4Press platform.
Data correspond to usage on the plateform after 2015. The current usage metrics is available 48-96 hours after online publication and is updated daily on week days.
Initial download of the metrics may take a while.