Fig. 1
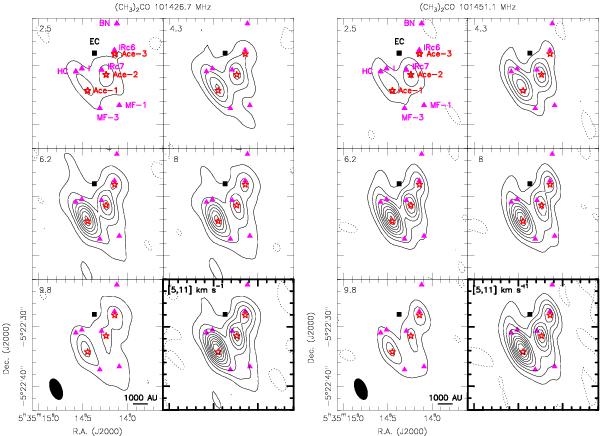
Left: channel maps of the (CH3)2CO emission at 101.43 GHz for a synthesized beam of  , where four (CH3)2CO lines, 91,8 − 82,7 AE/EA and 92,8 − 81,7 AE/EA (Eup/k = 26.9 K), are blended together. Contours run from 9 mJy beam-1 (3σ) to 114 mJy beam-1 in steps of 15 mJy beam-1, and the dashed contours represent –3 mJy beam-1. The bottom-right panel shows the integrated intensity (from 5 to 11 km s-1) in contours running from 10% to 90% in steps of 10% of the peak intensity (623.1 mJy beam-1 km s-1), and the dashed contours represent –5 mJy beam-1 km s-1 (1σ). Right: channel maps of the (CH3)2CO emission at 101.45 GHz in a synthesized beam of
  , where two (CH3)2CO lines, 91,8 − 82,7 EE and 92,8 − 81,7 EE (Eup/k = 26.8 K), are blended together. Contours run from 24 mJy beam-1 (8σ) to 216 mJy beam-1 in steps of 24 mJy beam-1, and the dashed contours represent –3 mJy beam-1. The bottom-right panel shows the integrated intensity (from 5 to 11 km s-1) in contours running from 10% to 90% in steps of 10% of the peak intensity (1.1 Jy beam-1 km s-1), and the dashed contours represent –0.005 mJy beam-1 km s-1 (1σ). The black square marks the center of explosion according to Zapata et al. (2009). The positions of source BN, HC, infrared sources IRc6/7, source I, methyl formate peaks (MF-1 and MF-3) are marked as triangles. The positions of acetone emission peaks (Ace-1 to Ace-3) are marked as stars.
Current usage metrics show cumulative count of Article Views (full-text article views including HTML views, PDF and ePub downloads, according to the available data) and Abstracts Views on Vision4Press platform.
Data correspond to usage on the plateform after 2015. The current usage metrics is available 48-96 hours after online publication and is updated daily on week days.
Initial download of the metrics may take a while.