Fig. 5
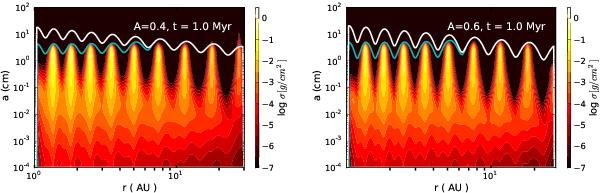
Vertically integrated dust density distribution after 5 Myr of evolution including radial drift and a bumpy gas surface density (Eq. (21)) with A = 0.4 (left panel) and A = 0.6 (right panel). Case of Rout = 30 AU, vf = 10 m s-1, p = 0.5 and αturb = 10-3. The solid white line represents the particle size corresponding to St = 1 (Eq. (3)) and reflects the shape of the gas density, while the cyan line corresponds to the fragmentation limit.
Current usage metrics show cumulative count of Article Views (full-text article views including HTML views, PDF and ePub downloads, according to the available data) and Abstracts Views on Vision4Press platform.
Data correspond to usage on the plateform after 2015. The current usage metrics is available 48-96 hours after online publication and is updated daily on week days.
Initial download of the metrics may take a while.