Fig. 3
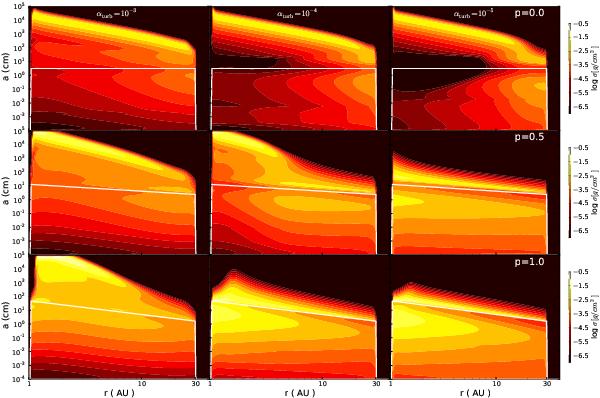
Vertically integrated dust density distribution after 1 Myr of evolution without radial drift. Case of Rout = 30 AU and vf = 30 m s-1 and different values of the gas density slope p = 0 (top panels), p = 0.5 (middle panels) and p = 1.0 (bottom panels); with the turbulence parameter αturb = 10-3 (left panels), αturb = 10-4 (center panels) and αturb = 10-5 (right panels). The solid white line represents the particle size corresponding to St = 1 (Eq. (3)) and reflects the shape of the gas density.
Current usage metrics show cumulative count of Article Views (full-text article views including HTML views, PDF and ePub downloads, according to the available data) and Abstracts Views on Vision4Press platform.
Data correspond to usage on the plateform after 2015. The current usage metrics is available 48-96 hours after online publication and is updated daily on week days.
Initial download of the metrics may take a while.