Fig. 3
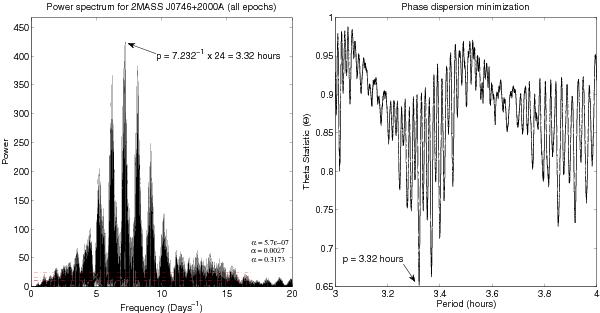
Left: Lomb-Scargle periodogram of all 2MASS J0746+20A epochs, calculated from the combined dataset from Fig. 1. The three red dashed-dotted horizontal lines (top-to-bottom) represent a 5σ, 3σ and 1σ false-alarm probability of the peaks, as determined by the LS periodogram algorithm. The x-axis is plotted in days-1, since each epoch was time-stamped in units of Heliocentric Julian Days (HJD) – for period accuracy over such a lengthy baseline. Right: phase dispersion minimization (PDM) plot of the entire ~2 year observation baseline. Here we plot the PDM “Theta (Θ) statistic” vs. Period (in hours), where the routines minimize the value at 3.32 h.
Current usage metrics show cumulative count of Article Views (full-text article views including HTML views, PDF and ePub downloads, according to the available data) and Abstracts Views on Vision4Press platform.
Data correspond to usage on the plateform after 2015. The current usage metrics is available 48-96 hours after online publication and is updated daily on week days.
Initial download of the metrics may take a while.