Free Access
Fig. 2
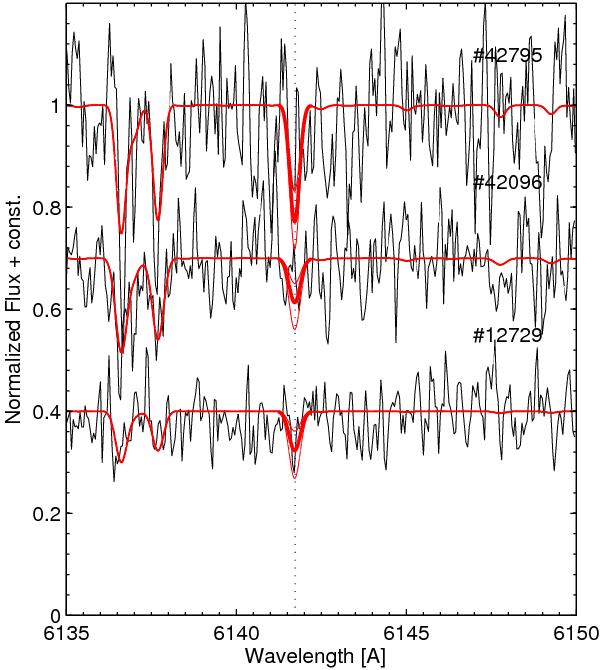
Same as Fig. 1, but for three fainter stars (in order of descending metallicity). For these spectra we could only derive upper limits on log ε⊙(Ba). The thick solid red lines refer to the 3σ limit of Table 1. The thin red lines shows the change when log ε(Ba) is varied by ± 0.4 dex.
Current usage metrics show cumulative count of Article Views (full-text article views including HTML views, PDF and ePub downloads, according to the available data) and Abstracts Views on Vision4Press platform.
Data correspond to usage on the plateform after 2015. The current usage metrics is available 48-96 hours after online publication and is updated daily on week days.
Initial download of the metrics may take a while.