Fig. 1
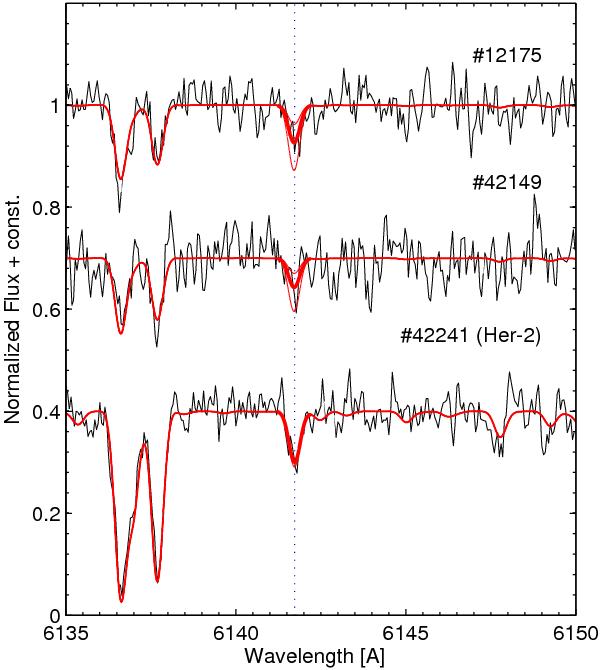
Spectra of the three brightest stars for which an EW could be measured for the Ba II 6141 Å line (indicated with a dotted vertical line). The strongest features in this wavelength range are the two Fe i lines to the left in the spectra (6136–6138 Å). Shown in red are synthetic spectra with the best-fit Ba-abundance (thick lines) and bracketing log ε(Ba) ± 0.4 dex (thin lines).
Current usage metrics show cumulative count of Article Views (full-text article views including HTML views, PDF and ePub downloads, according to the available data) and Abstracts Views on Vision4Press platform.
Data correspond to usage on the plateform after 2015. The current usage metrics is available 48-96 hours after online publication and is updated daily on week days.
Initial download of the metrics may take a while.