Free Access
Fig. 6
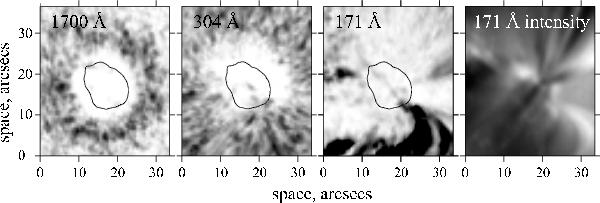
Propagation of the low-frequency oscillations. First three panels from left to right: spatial distribution of the 15 min oscillation power in the 1700 Å, 304 Å, and 171 Å. The fourth panel shows an image of the region in the 171 Å line intensity.
Current usage metrics show cumulative count of Article Views (full-text article views including HTML views, PDF and ePub downloads, according to the available data) and Abstracts Views on Vision4Press platform.
Data correspond to usage on the plateform after 2015. The current usage metrics is available 48-96 hours after online publication and is updated daily on week days.
Initial download of the metrics may take a while.