Free Access
Fig. 4
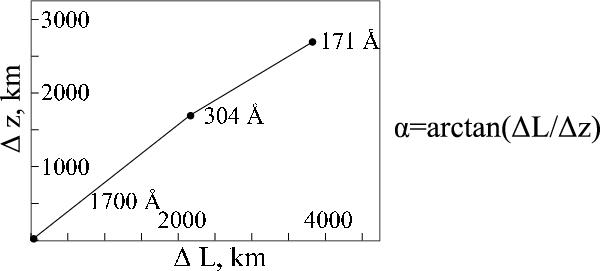
Graphical interpretation of the 5 min wave trajectory. The broken line represents the average magnetic field inclination to the vertical derived from the horizontal displacements (ΔL) and the estimations of the differences between the line formation heights (Δz).
Current usage metrics show cumulative count of Article Views (full-text article views including HTML views, PDF and ePub downloads, according to the available data) and Abstracts Views on Vision4Press platform.
Data correspond to usage on the plateform after 2015. The current usage metrics is available 48-96 hours after online publication and is updated daily on week days.
Initial download of the metrics may take a while.