Fig. 3
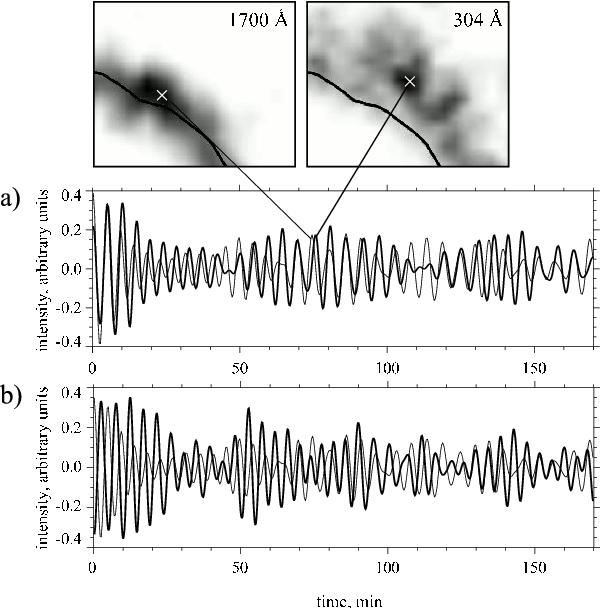
Phase relations between the 5 min oscillations at 1700 Å (thin) and 304 Å (thick) levels. The signals were filtered in the 0.8 mHz band centered at 3.3 mHz. a) The points for the different layers were selected accounting for the trajectory inclination, so that the filtered oscillation wave trains in the points showed the maximal correspondence (correlation coefficient is 0.7). b) The signals from the points located above each other at the line of sight at the point marked in the 1700 Å panel show less correspondence (correlation coefficient is 0.35).
Current usage metrics show cumulative count of Article Views (full-text article views including HTML views, PDF and ePub downloads, according to the available data) and Abstracts Views on Vision4Press platform.
Data correspond to usage on the plateform after 2015. The current usage metrics is available 48-96 hours after online publication and is updated daily on week days.
Initial download of the metrics may take a while.