Fig. 2
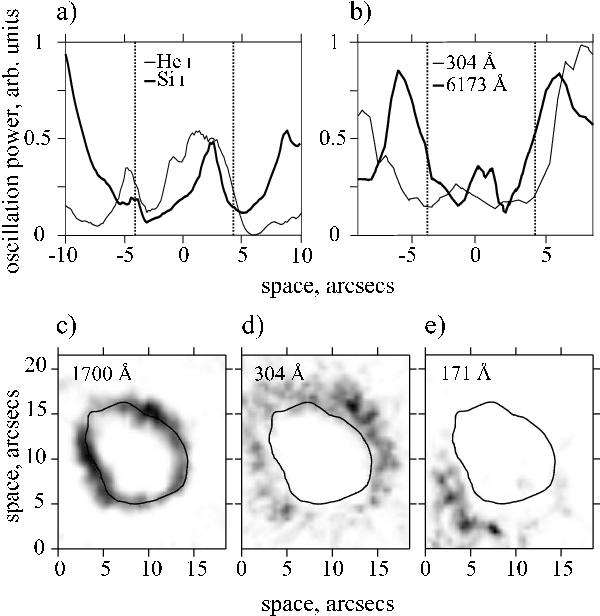
Spatial distribution of the 5 min oscillation power a) along the slit of the ground-based telescope (Si i 10827 Å and He i 10830 Å); b) along the slit in the 304 Å and HMI Fe i 6173 Å signals; c) in the 1700 Å continuum; d) in the 304 Å line; e) in the 171 Å line. Only the pixels with oscillation power exceeding 3σ2 level are plotted on the distributions on the panels c)–e). The darker a point, the higher is the oscillation power in it.
Current usage metrics show cumulative count of Article Views (full-text article views including HTML views, PDF and ePub downloads, according to the available data) and Abstracts Views on Vision4Press platform.
Data correspond to usage on the plateform after 2015. The current usage metrics is available 48-96 hours after online publication and is updated daily on week days.
Initial download of the metrics may take a while.