Fig. 9
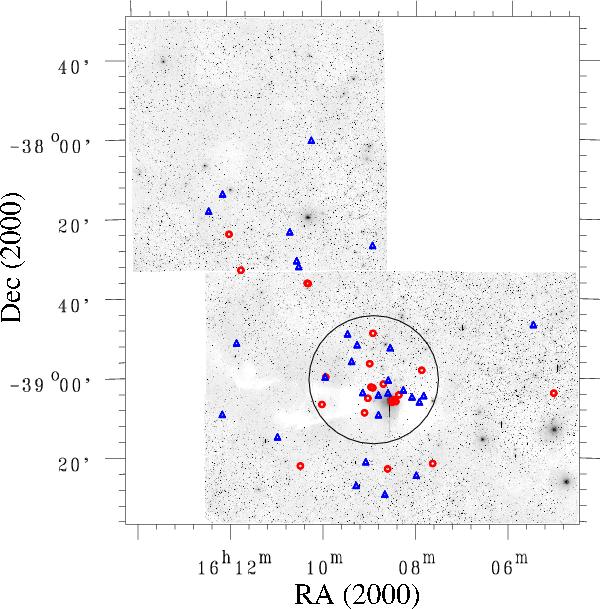
R-band image of Lupus 3 (from CSL) marking the positions of spectroscopically confirmed members having an estimated log g = 3.5 − 4.0 that fulfill the criterion described by CSL to identify possible members of the Lupus clouds, including those members already identified in previous studies. Red circles represent objects with significant infrared excess (spectral index n > − 2) and blue triangles are objects with moderate or no excess. The large circumference marks the limits of the area chosen to split the sample into an “on-cloud” population and a “distributed” population, as discussed in the text.
Current usage metrics show cumulative count of Article Views (full-text article views including HTML views, PDF and ePub downloads, according to the available data) and Abstracts Views on Vision4Press platform.
Data correspond to usage on the plateform after 2015. The current usage metrics is available 48-96 hours after online publication and is updated daily on week days.
Initial download of the metrics may take a while.