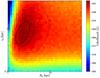
Fig. 6
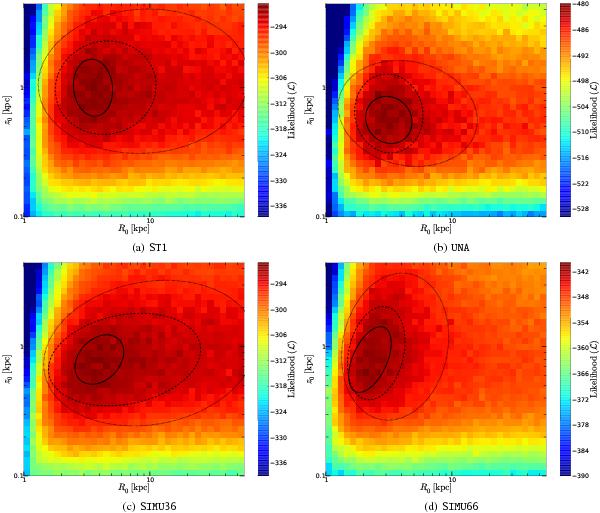
Log-likelihood as a function of radial scale length (R0 or σr) and vertical scale height (z0) for the model ST1. The panels show (from top left to bottom right) the results for 36 MSPs a), 66 MSP candidates b), 36 mock MSPs c), and 66 mock MSPs d). Contours show the 1, 2, and 3σ confidence ellipses that have been computed from the log-likelihood maps (colours). All maps show the same dynamic range in log-likelihood.
Current usage metrics show cumulative count of Article Views (full-text article views including HTML views, PDF and ePub downloads, according to the available data) and Abstracts Views on Vision4Press platform.
Data correspond to usage on the plateform after 2015. The current usage metrics is available 48-96 hours after online publication and is updated daily on week days.
Initial download of the metrics may take a while.