Free Access
Fig. 2
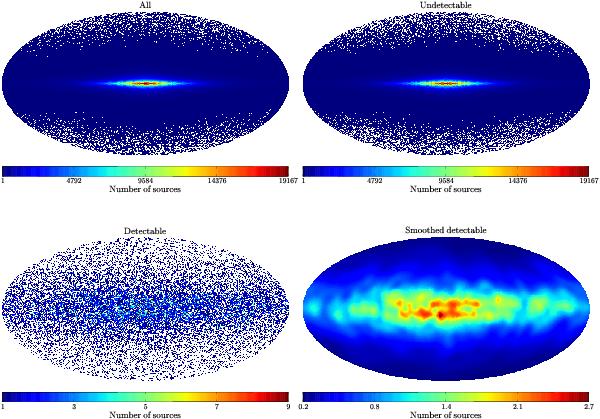
HEALPix maps (Nside = 64) for R0 = 4.2 kpc and σz = 500 pc using the Story et al. (2007) luminosity model. The panels show the entire simulated MSP population (top left), the undetectable (top right) and detectable (bottom left) samples, and the smoothed detectable sample (bottom right).
Current usage metrics show cumulative count of Article Views (full-text article views including HTML views, PDF and ePub downloads, according to the available data) and Abstracts Views on Vision4Press platform.
Data correspond to usage on the plateform after 2015. The current usage metrics is available 48-96 hours after online publication and is updated daily on week days.
Initial download of the metrics may take a while.