Fig. 1
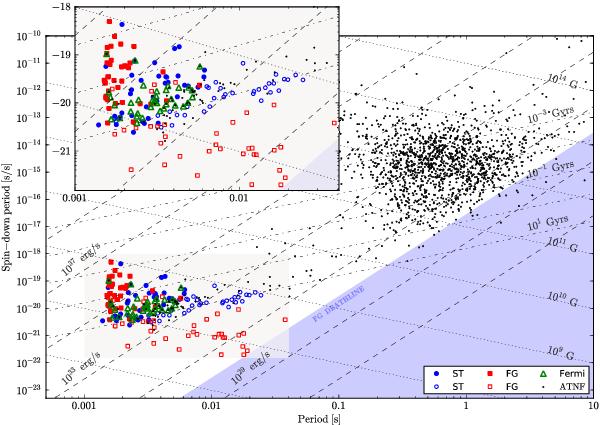
Simulated P − Ṗ distribution of the detectable sample (filled symbols) and an according undetectable sample (open symbols) using the approaches of Faucher-Giguère & Loeb (2010) (red squares) and of Story et al. (2007) (blue circles). We use [σr = 5, z0 = 1] kpc and [R0 = 4.2, z0 = 0.5] kpc respectively for Faucher-Giguère & Loeb and Story et al. approaches. For comparison we show the observed distribution of Fermi-LAT MSPs as green triangles. The P − Ṗ distribution of all pulsars from the ATNF catalogue (Manchester et al. 2005, http://www.atnf.csiro.au/research/pulsar/psrcat) is shown as black dots. We also show lines of constant spin-down power Ė (dashed), constant characteristic age (dashed-dotted), and constant magnetic field (dotted). The area excluded by the deathline implemented in Faucher-Giguère & Loeb’s model is indicated by the blue filled area. The inset presents a zoom into the MSP region of the P − Ṗ diagram.
Current usage metrics show cumulative count of Article Views (full-text article views including HTML views, PDF and ePub downloads, according to the available data) and Abstracts Views on Vision4Press platform.
Data correspond to usage on the plateform after 2015. The current usage metrics is available 48-96 hours after online publication and is updated daily on week days.
Initial download of the metrics may take a while.