Fig. 9
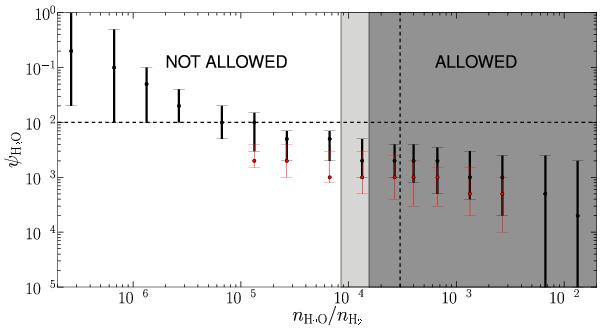
OH 127.8+0.0 H2O emission spectrum modeling results for the temperature law and mass-loss rate of Models 1 and 2 in Table 4 in red and black, respectively. ψH2O and its uncertainty is determined for a wide range of (ortho + para) H2O vapor abundances. From the modeling of the IR continuum and the CO data, a value of ψdens = 0.01 is determined. The expected H2O vapor abundance from chemical models is 3 × 10⁻⁴ (Cherchneff 2006). Both values are indicated by the dashed black lines. The dark gray area indicates the lower limit defined by the critical H2O vapor abundance derived from the H2O ice fraction of Model 2, see Sect. 4.2.5. For comparison, the light gray area indicates the lower limit found for Model 1.
Current usage metrics show cumulative count of Article Views (full-text article views including HTML views, PDF and ePub downloads, according to the available data) and Abstracts Views on Vision4Press platform.
Data correspond to usage on the plateform after 2015. The current usage metrics is available 48-96 hours after online publication and is updated daily on week days.
Initial download of the metrics may take a while.