Fig. 2
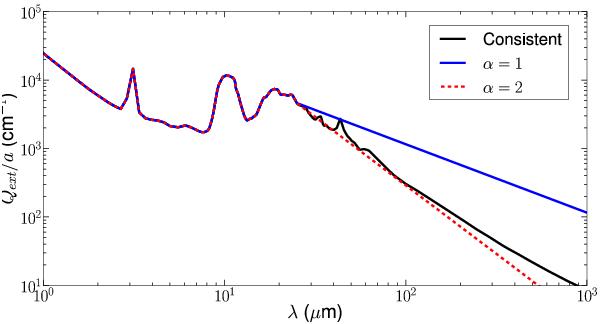
Dust extinction efficiencies divided by grain size (in cm-1) versus wavelength (in μm) used for the models shown in Figs. 3 and 4. At λ < 25 μm the profiles are identical. From 25 μm onward, the blue full line and the red dashed line show a profile where the region at λ > 25 μm is replaced with a power law of the form Qext/a ~ λ− α assuming α = 1 and α = 2, respectively. The black full line is representative of a typical oxygen-rich OH/IR extinction profile as used in MCMax, for which the dust composition is given in Table 3.
Current usage metrics show cumulative count of Article Views (full-text article views including HTML views, PDF and ePub downloads, according to the available data) and Abstracts Views on Vision4Press platform.
Data correspond to usage on the plateform after 2015. The current usage metrics is available 48-96 hours after online publication and is updated daily on week days.
Initial download of the metrics may take a while.