Fig. 13
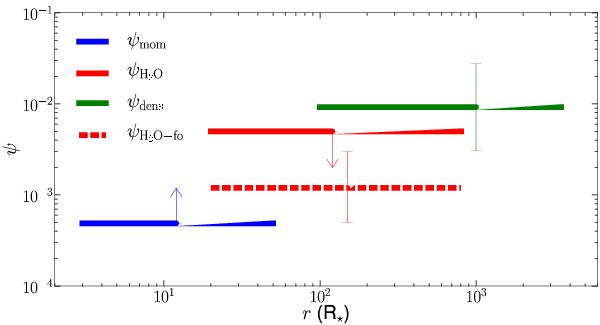
Results of determining the dust-to-gas ratio using the three different methods described in Sect. 3.5.3 are shown for Model 2 in Table 4. The horizontal bar indicates the part of the envelope traced by the method. The vertical bar indicates the uncertainty on the indicated value. ψmom is a lower limit, whereas ψH2O is an upper limit. For reference, the dashed red line indicates ψH2O − fo assuming 20% freeze-out of H2O vapor into H2O ice. The relative differences between the three values of the dust-to-gas ratio for the other models in Table 4 are similar, but scale upward or downward uniformly depending on the gas-mass-loss rate. See Sect. 4.3 for a more detailed description.
Current usage metrics show cumulative count of Article Views (full-text article views including HTML views, PDF and ePub downloads, according to the available data) and Abstracts Views on Vision4Press platform.
Data correspond to usage on the plateform after 2015. The current usage metrics is available 48-96 hours after online publication and is updated daily on week days.
Initial download of the metrics may take a while.