Fig. 11
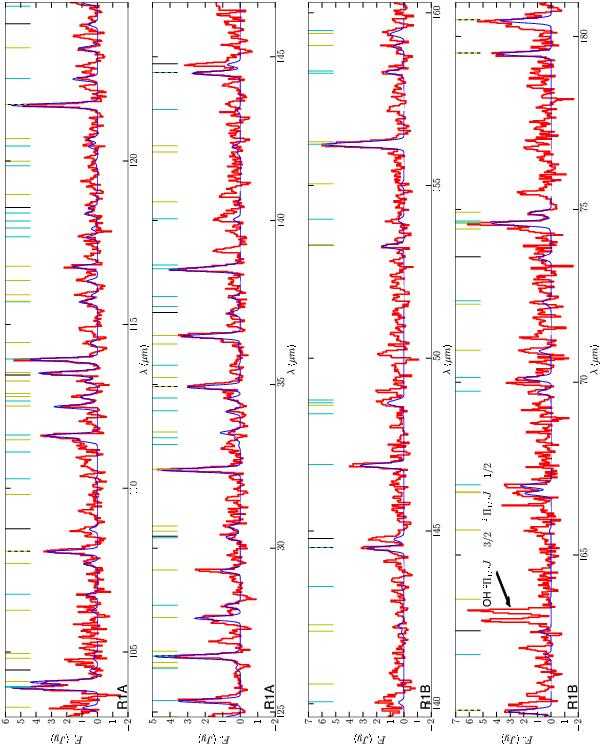
Continuum-subtracted PACS spectrum of OH 127.8+0.0 is shown in red for the red bands. The PACS band is indicated in the lower left corner of each spectrum. Model 2 in Table 4 with nH2O/nH2 = 3 × 10⁻⁴ and ψH2O = 0.003 is given in blue. The other parameters are listed in Tables 1 and 2. The colored vertical lines indicate the molecule contributing at that specific wavelength, with full black for 12CO, yellow for ortho-H2O, and cyan for para-H2O. The dashed black-colored lines indicate the water lines used for the initial H2O line fitting. The OH rotational cascade line  at ~162.9 μm (not included in our modeling) is labeled. At ~ 144.9 μm, another strong line appears both in band R1A and band R1B. A different wavelength sampling causes the line in band R1B to appear weaker, but the integrated line fluxes of both lines are within the absolute flux calibration uncertainty of PACS. This line remains unidentified. The CO line alone cannot explain the observed integrated line flux at this wavelength.
Current usage metrics show cumulative count of Article Views (full-text article views including HTML views, PDF and ePub downloads, according to the available data) and Abstracts Views on Vision4Press platform.
Data correspond to usage on the plateform after 2015. The current usage metrics is available 48-96 hours after online publication and is updated daily on week days.
Initial download of the metrics may take a while.