Free Access
Fig. 7
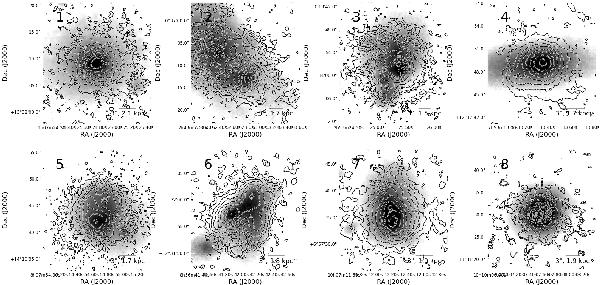
Images of the target galaxies. East is left and north is up. The contours show the Hα emission, while the inverted grey scale background shows the continuum from the Hα off-line spectral region. The numbers refer to the running numbers in Table 1.
Current usage metrics show cumulative count of Article Views (full-text article views including HTML views, PDF and ePub downloads, according to the available data) and Abstracts Views on Vision4Press platform.
Data correspond to usage on the plateform after 2015. The current usage metrics is available 48-96 hours after online publication and is updated daily on week days.
Initial download of the metrics may take a while.