Fig. 4
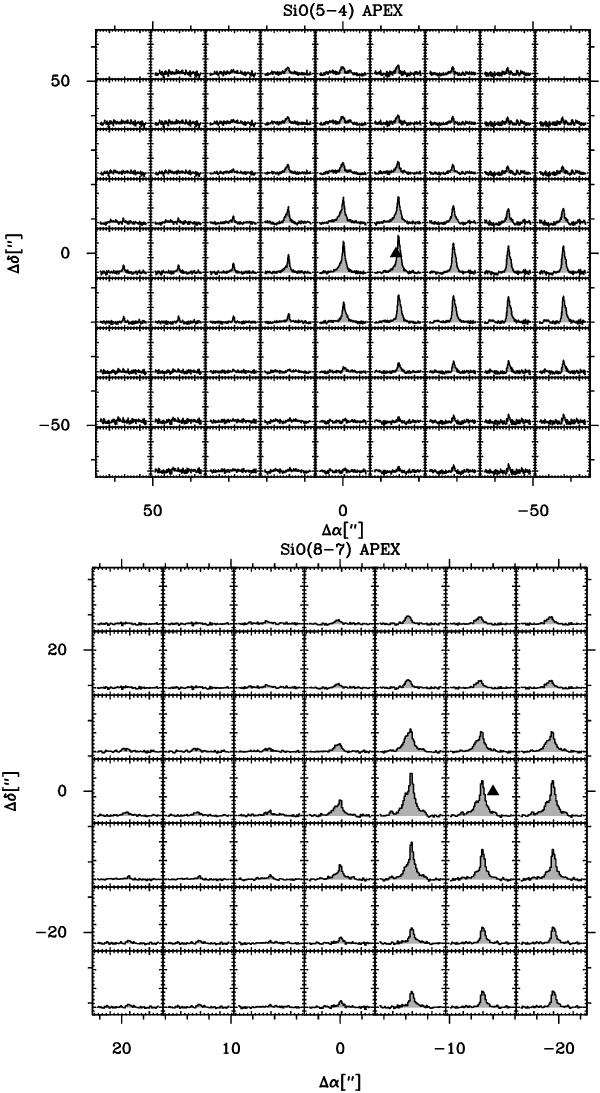
SiO(5−4) (top panel) and (8–7) (bottom panel) maps observed with the APEX telescope. The velocity axis extendes from − 95 to 85 km s-1 for both data sets, while the temperature scale is covers − 0.4 to 3 K. The data are shown with the original angular resolution of 30 5 (SiO(5−4)) and 191 (SiO(8–7)). The centre of the maps is given in Table 1. The black triangle marks the peak position (SiO-APEX, see Table 2) of the integrated intensity SiO(5−4) and (8–7) maps (in the velocity range − 40 < ν < 40 km s-1) smoothed to the angular resolution of the SiO(5−4) data, 305.
Current usage metrics show cumulative count of Article Views (full-text article views including HTML views, PDF and ePub downloads, according to the available data) and Abstracts Views on Vision4Press platform.
Data correspond to usage on the plateform after 2015. The current usage metrics is available 48-96 hours after online publication and is updated daily on week days.
Initial download of the metrics may take a while.