Fig. 2
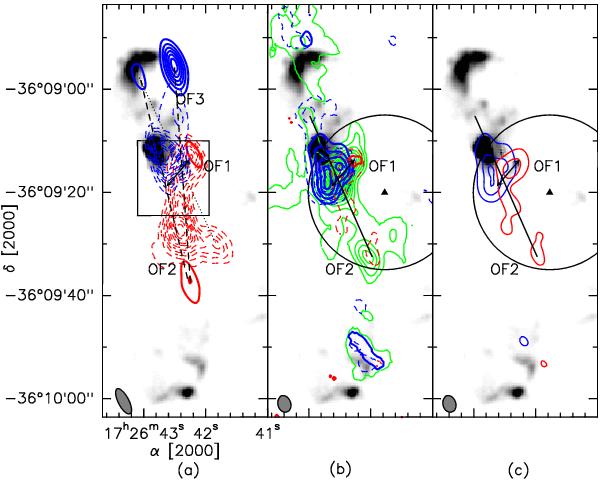
Left panel: integrated emission of the CO(2–1) blue- and red-shifted wings. The solid contours show the EHV blue- and red-shifted emission; the dashed contours mark the HV blue- and red-shifted emission (see Paper I, Fig. 3). The dashed and solid lines outline the possible molecular outflows (OF1, OF2, OF3); the dotted line marks the alternative direction of the OF2 outflow. The central box is the region mapped in Fig. 1. Middle panel: Integrated emission of the SiO(5−4) line: the dashed blue and red contours are the LV blue- and red-shifted emission (νbl = [− 20, − 10] km s-1, from 5σ (2.5 Jy/beam) in steps of 10σ; νrd = [+ 10, + 39] km s-1, from 5σ (6 Jy/beam) in steps of 10σ), the thick contours the HV blue- and red-shifted emission (νbl = [− 50, − 20] km s-1, from 5σ (4 Jy/beam) in steps of 10σ; νrd = [+ 50, + 70] km s-1, 4σ (2.4 Jy/beam)). The green contours are the integrated emission at ambient velocities (νgr = [− 10, + 10] km s-1; from 5σ (3 Jy/beam) in steps of 10σ). Right panel: integrated emission of the SiO(5−4) line in the velocity ranges used for modelling the SiO emission in Sect. 4: the blue and red contours are the blue- and red-shifted emission in the ranges (νbl = [− 30, − 20] km s-1, from 5σ (4 Jy/beam) in steps of 10σ; νrd = [+ 10, + 39] km s-1, from 5σ (6.5 Jy/beam) in steps of 10σ). In the three panels, the solid line marks the axis of OF2 as identified in SiO. The arrowed line marks that of OF1. The solid circle represents the APEX 30 5 beam centred on
  , δ[J2000] = − 36°09′20″, the position used in Sect. 4 for our modelling of the SiO emission (SiO-APEX, see Table 2) and here labelled by a black triangle. In both panels, the grey scale represents the H2 emission at 2.12 μm (Paper I).
Current usage metrics show cumulative count of Article Views (full-text article views including HTML views, PDF and ePub downloads, according to the available data) and Abstracts Views on Vision4Press platform.
Data correspond to usage on the plateform after 2015. The current usage metrics is available 48-96 hours after online publication and is updated daily on week days.
Initial download of the metrics may take a while.