Free Access
Fig. 12
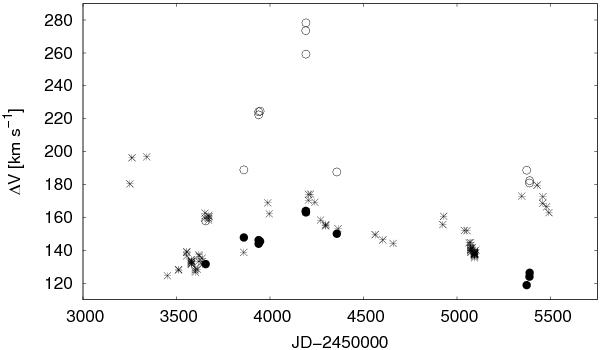
Peak separation ΔV of the Hα line (asterisks). The empty circles denote the difference between the position of the blue bump in the violet peak and red peak. The full circles are values corresponding to the red bump in the violet peak and red peak.
Current usage metrics show cumulative count of Article Views (full-text article views including HTML views, PDF and ePub downloads, according to the available data) and Abstracts Views on Vision4Press platform.
Data correspond to usage on the plateform after 2015. The current usage metrics is available 48-96 hours after online publication and is updated daily on week days.
Initial download of the metrics may take a while.