Fig. 7
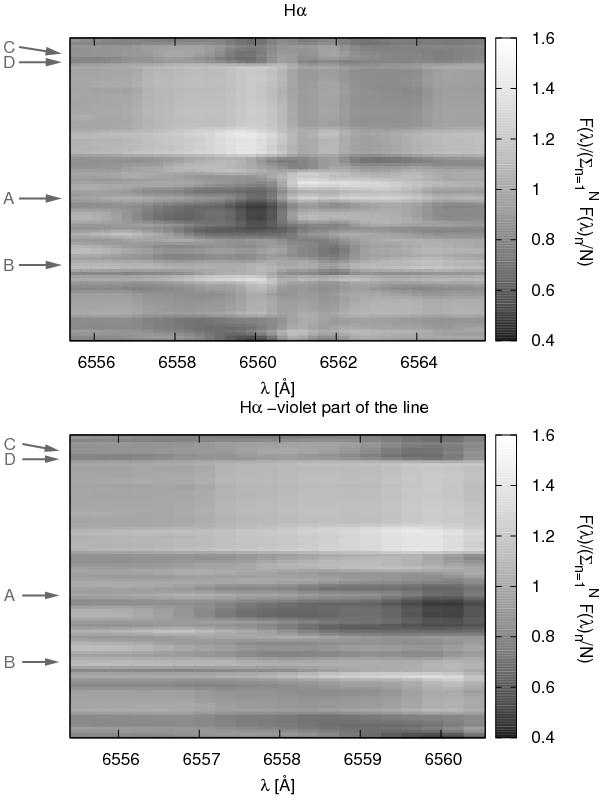
Grey-scale representation of the Hα line. A close-up of the violet part is shown in the bottom panel. The time scale on the y-axis is not conserved. The spectra are sorted by their sequential number from oldest (lowermost) to latest (uppermost). Marks on the left side of the figure point at the special events detected in the iron lines (see Fig. 17). Spectrum denoted by “D” shows an inverse P Cygni profile of the He i 6678 Å line.
Current usage metrics show cumulative count of Article Views (full-text article views including HTML views, PDF and ePub downloads, according to the available data) and Abstracts Views on Vision4Press platform.
Data correspond to usage on the plateform after 2015. The current usage metrics is available 48-96 hours after online publication and is updated daily on week days.
Initial download of the metrics may take a while.