Free Access
Fig. 3
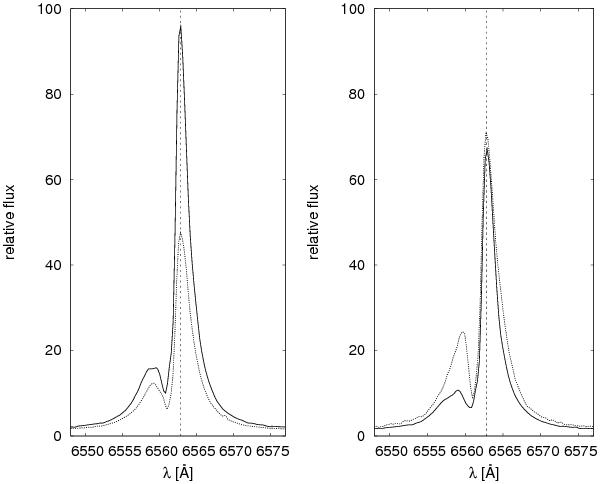
Selected line profiles. Left panel: maximum (JD 2 454 357.47) and minimum (JD 2 455 479.35) intensity of the red peak. Right panel: maximum (JD 2 455 073.46) and minimum (JD 2 454 206.52) intensity of the violet peak.
Current usage metrics show cumulative count of Article Views (full-text article views including HTML views, PDF and ePub downloads, according to the available data) and Abstracts Views on Vision4Press platform.
Data correspond to usage on the plateform after 2015. The current usage metrics is available 48-96 hours after online publication and is updated daily on week days.
Initial download of the metrics may take a while.