Fig. 23
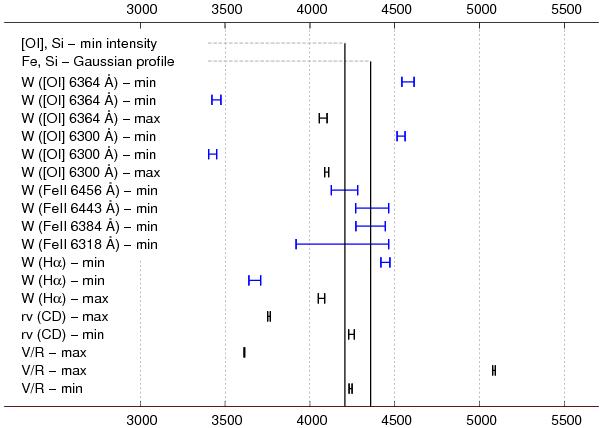
Timeline of characteristic events in the spectra. The found extrema of the time dependencies of individual spectral quantities are plotted in this figure. V/R denotes the ratio of violet and red peak intensity of the Hα line, rv(CD) denotes the radial velocity of the central depression of the Hα and W extrema of equivalent widths of selected lines. The equivalent width notation follows its definition – negative values denote the emission lines (minima of W in this figure is related to the maxima of “line strength”). The vertical line indicates the time when the iron and silicon line profile become Gaussian (a bright spot on the grey-scale representation in Figs. 17 and 21). Another vertical line shows the time when forbidden oxygen and silicon lines reach their minimum intensity (the darkest spot on the grey-scale representation in Figs. 19 and 21).
Current usage metrics show cumulative count of Article Views (full-text article views including HTML views, PDF and ePub downloads, according to the available data) and Abstracts Views on Vision4Press platform.
Data correspond to usage on the plateform after 2015. The current usage metrics is available 48-96 hours after online publication and is updated daily on week days.
Initial download of the metrics may take a while.