Free Access
Fig. 19
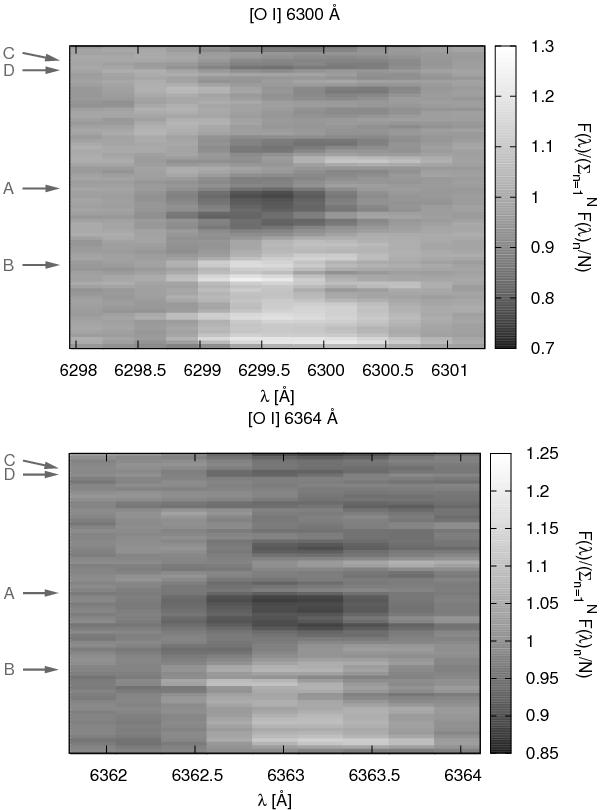
Grey-scale representation of the [O i] lines at λ = 6300 Å (upper panel) and 6364 Å (bottom panel). Notation corresponds with the Fig. 17. The mark “D” points at the spectrum with the inverse P Cygni profile of the He i 6678 Å line.
This figure is made of several images, please see below:
Current usage metrics show cumulative count of Article Views (full-text article views including HTML views, PDF and ePub downloads, according to the available data) and Abstracts Views on Vision4Press platform.
Data correspond to usage on the plateform after 2015. The current usage metrics is available 48-96 hours after online publication and is updated daily on week days.
Initial download of the metrics may take a while.