Fig. 8
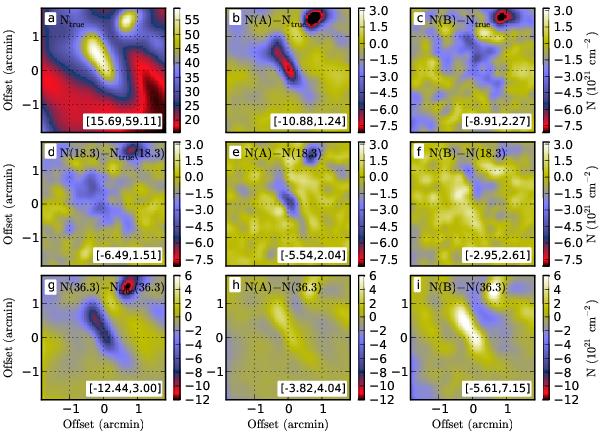
Comparison of column density estimates in a 0.5 pc × 0.5 pc area in Cloud II. Frame a) shows the true column density and frames d) and g) the errors for column density maps derived with all data at a resolution of 18.3″ or 36.3″. The second and the third columns show the difference between Method A and Method B relative to the true column density (first row) and the estimates obtained with all surface brightness data either at 18.3″ (second row) or 36.3″ resolution (third row). The numbers at the bottom of each frame show the range of values within the map.
Current usage metrics show cumulative count of Article Views (full-text article views including HTML views, PDF and ePub downloads, according to the available data) and Abstracts Views on Vision4Press platform.
Data correspond to usage on the plateform after 2015. The current usage metrics is available 48-96 hours after online publication and is updated daily on week days.
Initial download of the metrics may take a while.