Free Access
Fig. 3
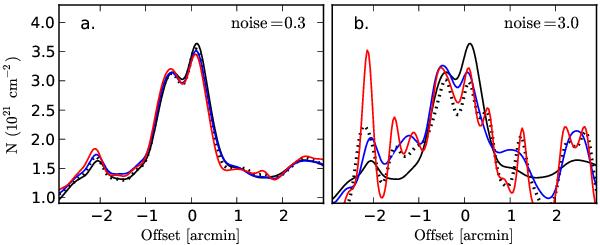
Column density profiles for a horizontal cut through the maps in Fig. 2. The noise levels are given in the frames. The lines show the true column density (black line), the column density derived from 18″ resolution surface brightness data (dotted line) and the results of Methods A and B (blue and red lines, respectively).
Current usage metrics show cumulative count of Article Views (full-text article views including HTML views, PDF and ePub downloads, according to the available data) and Abstracts Views on Vision4Press platform.
Data correspond to usage on the plateform after 2015. The current usage metrics is available 48-96 hours after online publication and is updated daily on week days.
Initial download of the metrics may take a while.