Fig. 20
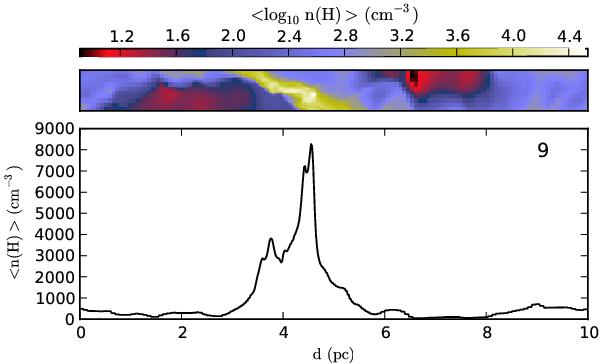
The line-of-sight structure of the field number 9. The data consist of the density values within the modelled 5.3′ × 5.3′ area, along the full 10 pc distance through the Cloud II cloud. The upper image shows that density averaged over one direction perpendicular to the line-of-sight. The lower plot shows the mean density as the function of line-of-sight distance. The main structure is a filament with the long axis at ~30 degree angle with respect to the line-of-sight.
Current usage metrics show cumulative count of Article Views (full-text article views including HTML views, PDF and ePub downloads, according to the available data) and Abstracts Views on Vision4Press platform.
Data correspond to usage on the plateform after 2015. The current usage metrics is available 48-96 hours after online publication and is updated daily on week days.
Initial download of the metrics may take a while.