Fig. 2
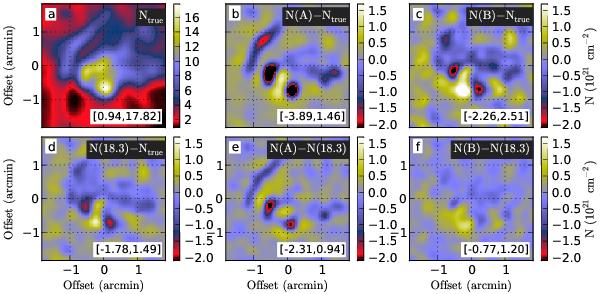
Column density maps for a selected small region in Cloud I. Frame a) shows the true column density of the model cloud and the frames b) and c) the errors in the estimates of Method A and Method B, respectively (N(A) − Ntrue and N(B) − Ntrue). Frame d) shows the column density errors when estimates are calculated using data with 18.3″ resolution at all wavelengths, N(18.3) − Ntrue. The frames e–f) show the errors of Method A and Method B relative to the estimates from 18.3″ resolution data. The range of data values is given at the bottom of each frame.
Current usage metrics show cumulative count of Article Views (full-text article views including HTML views, PDF and ePub downloads, according to the available data) and Abstracts Views on Vision4Press platform.
Data correspond to usage on the plateform after 2015. The current usage metrics is available 48-96 hours after online publication and is updated daily on week days.
Initial download of the metrics may take a while.