Fig. 19
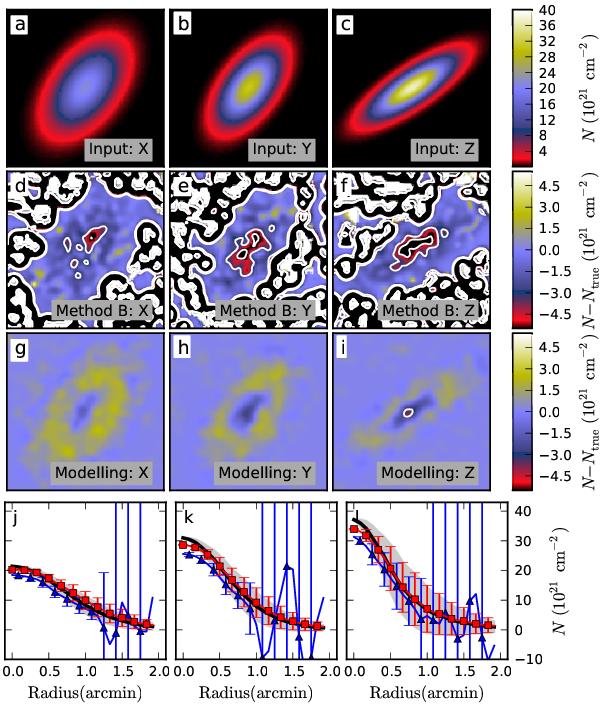
Results for the ellipsoid model. The frames a)–c) show the true column densities towards three directions. The errors in the column density estimates of Method B and of the 3D modelling are shown in frames d)–f) and g)–i), respectively, with contours drawn at − 3 × 1021cm-2 and − 6 × 1021cm-2. The bottom frames show the radial column density profiles. The true column density is shown with a black solid line, the grey area indicating the 1σ variation in the averaged rings. The triangles correspond to Method B and the square symbols to the 3D modelling. The error bars indicate the corresponding 1σ variation in the averaged rings.
Current usage metrics show cumulative count of Article Views (full-text article views including HTML views, PDF and ePub downloads, according to the available data) and Abstracts Views on Vision4Press platform.
Data correspond to usage on the plateform after 2015. The current usage metrics is available 48-96 hours after online publication and is updated daily on week days.
Initial download of the metrics may take a while.