Free Access
Fig. 18
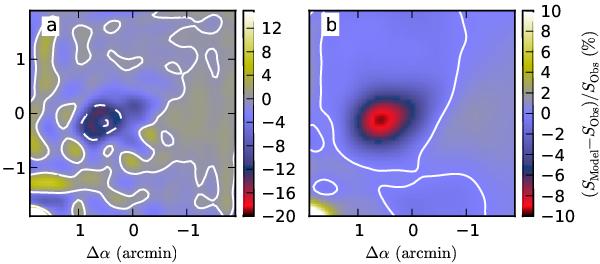
Core 4 modelled with anisotropic radiation field and varying line-of-sight width of the density distribution. The maps show the relative error of the model predictions at 160 μm (frame a) and at 500 μm (frame b). The contours are at intervals of 10%.
Current usage metrics show cumulative count of Article Views (full-text article views including HTML views, PDF and ePub downloads, according to the available data) and Abstracts Views on Vision4Press platform.
Data correspond to usage on the plateform after 2015. The current usage metrics is available 48-96 hours after online publication and is updated daily on week days.
Initial download of the metrics may take a while.