Fig. 17
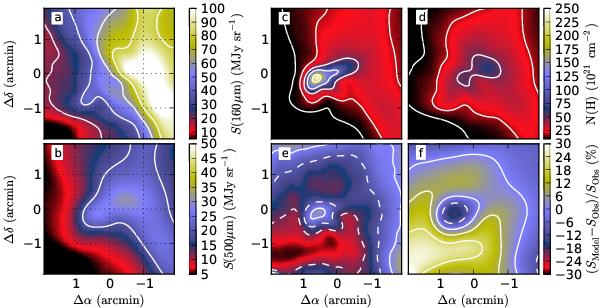
Core 4 modelled with anisotropic radiation field. Frames a) and b) are the 160 μm and 500 μm surface brightness maps from Cloud II (the “observations”). The core is visible in the map of the true column density (frame c) but is missed by the constructed model (frame d). Frames e) and f) show the errors of the model predictions SModel relative to the observed surface brightness SObs at the wavelengths of 160 μm and 500 μm, respectively.
Current usage metrics show cumulative count of Article Views (full-text article views including HTML views, PDF and ePub downloads, according to the available data) and Abstracts Views on Vision4Press platform.
Data correspond to usage on the plateform after 2015. The current usage metrics is available 48-96 hours after online publication and is updated daily on week days.
Initial download of the metrics may take a while.