Free Access
Fig. 15
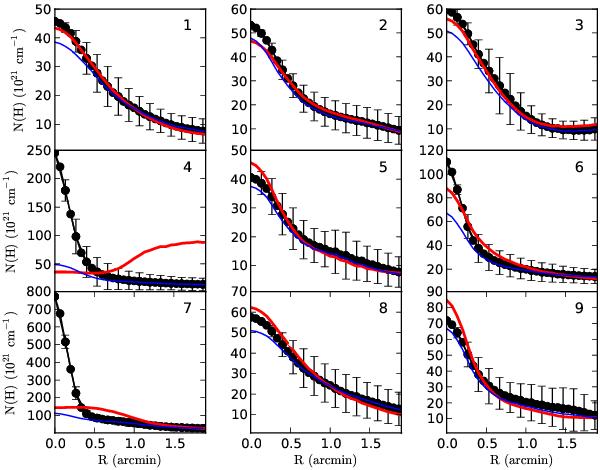
Azimuthally-averaged column density profiles of the selected nine cores. The black symbols and error bars show the true column density and the variation in 4″ wide annuli. The blue solid curve is the estimate from Method B and the red solid curve the profile obtained from the constructed radiative transfer model.
Current usage metrics show cumulative count of Article Views (full-text article views including HTML views, PDF and ePub downloads, according to the available data) and Abstracts Views on Vision4Press platform.
Data correspond to usage on the plateform after 2015. The current usage metrics is available 48-96 hours after online publication and is updated daily on week days.
Initial download of the metrics may take a while.