Fig. 10
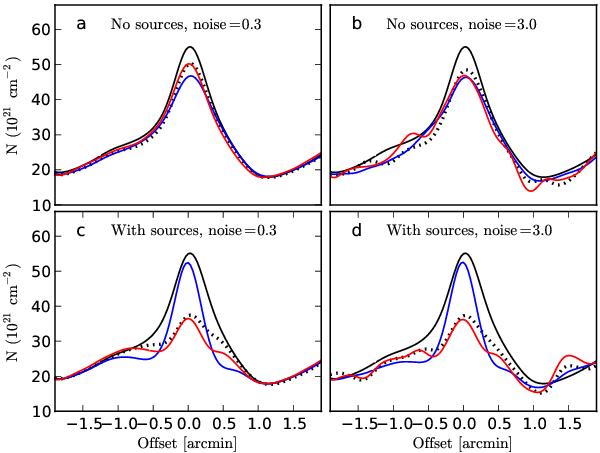
Column density profiles for a horizontal cut through the maps Figs. 8−9. Shown are the true column density (solid black line; uppermost lines, convolved to 18.3″ resolution), the estimate derived from 18.3″ data at all wavelengths (black dotted line), Method A (blue solid line), and Method B (red solid line). The lower frames correspond to the case with an internal heating source. The noise is 0.3 times (frames a and c) or 3.0 times (frames b and d) times the default value.
Current usage metrics show cumulative count of Article Views (full-text article views including HTML views, PDF and ePub downloads, according to the available data) and Abstracts Views on Vision4Press platform.
Data correspond to usage on the plateform after 2015. The current usage metrics is available 48-96 hours after online publication and is updated daily on week days.
Initial download of the metrics may take a while.