Fig. 1
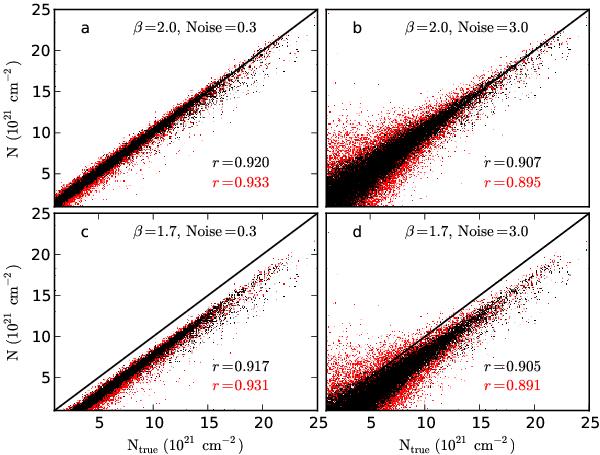
Column densities estimated with Method A (black points) and Method B (red points) versus the true column density of Cloud I. The frames correspond to 0.3 or 3.0 times the default noise (see text). The numbers indicate the correlation coefficients r for Method A and Method B, respectively, for data with Ntrue > 5 × 1021 cm-2. For illustration, we have included in the lower frames the corresponding results obtained with a spectral index value of β = 1.7 instead of β = 2.0.
Current usage metrics show cumulative count of Article Views (full-text article views including HTML views, PDF and ePub downloads, according to the available data) and Abstracts Views on Vision4Press platform.
Data correspond to usage on the plateform after 2015. The current usage metrics is available 48-96 hours after online publication and is updated daily on week days.
Initial download of the metrics may take a while.