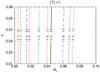
Fig. 3
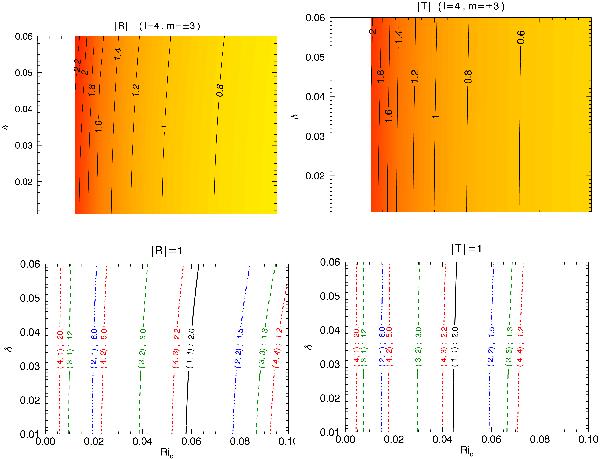
Level lines of reflection |R| and transmission |T| coefficients of an IGW at a critical layer as a function of the Richardson number Ric and the thickness δ of the critical layer (zone II in Fig. 2). The top panels represent the level lines for an arbitrarily chosen value of (l,m) = (4, ± 3), while the bottom panels show level lines |R| = 1 and |T| = 1 for different couples (l,m).
Current usage metrics show cumulative count of Article Views (full-text article views including HTML views, PDF and ePub downloads, according to the available data) and Abstracts Views on Vision4Press platform.
Data correspond to usage on the plateform after 2015. The current usage metrics is available 48-96 hours after online publication and is updated daily on week days.
Initial download of the metrics may take a while.