Free Access
Fig. 2
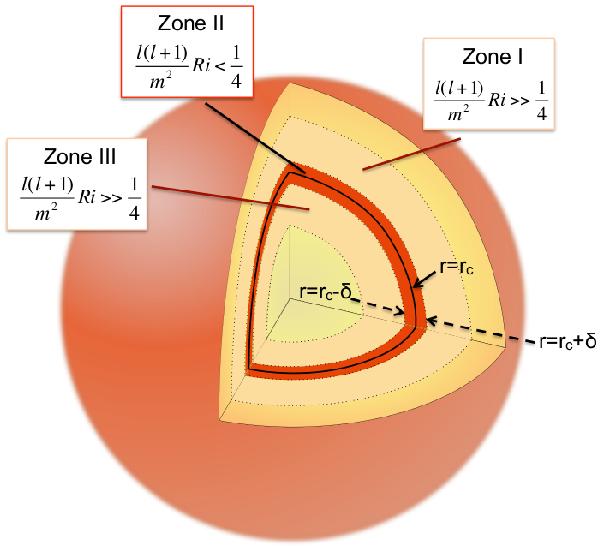
Assumed neighbourhood of an unstable critical layer for the calculation of the IGW’s reflection and transmission coefficients. We assume that the unstable region around the critical layer (in red) has a thickness given by 2δ (zone II). The surrounding regions where IGW are propagative are in beige (zones I and III).
Current usage metrics show cumulative count of Article Views (full-text article views including HTML views, PDF and ePub downloads, according to the available data) and Abstracts Views on Vision4Press platform.
Data correspond to usage on the plateform after 2015. The current usage metrics is available 48-96 hours after online publication and is updated daily on week days.
Initial download of the metrics may take a while.