Fig. 7
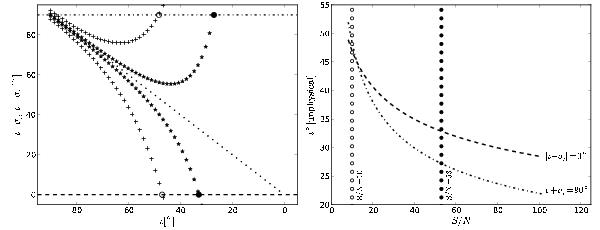
Left: 1-σ uncertainty in the inclinations vs. source inclinations for two values of S/N: plusses (outer curves) correspond to S/N = 10, stars (inner curves) correspond to S/N = 53. The curves above the dotted line correspond to ι + σι, and those below to ι − σι. The thick horizontal dashed and dashed-dotted lines are the physical limits of ι: below the line of ι ± σι = 0° and above the line of ι ± σι = 90°, σι can be truncated, since that value of ι is bounded between [0°,90°]. Right: “unphysical ι” versus S/N for the systems from MC1. The thick dashed-dotted line calculated from the condition ι − σι = 0°, and the thick dashed line from the condition ι + σι = 90° demonstrated in the left panel. At an S/N of 10, the in open circles show a lower limit and the filled circles show an upper limit at the intersections with the two curves from the conditions above.
Current usage metrics show cumulative count of Article Views (full-text article views including HTML views, PDF and ePub downloads, according to the available data) and Abstracts Views on Vision4Press platform.
Data correspond to usage on the plateform after 2015. The current usage metrics is available 48-96 hours after online publication and is updated daily on week days.
Initial download of the metrics may take a while.