Free Access
Fig. C.1
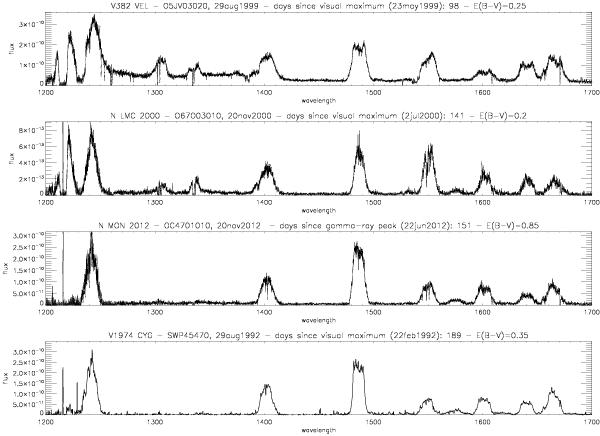
Short wavelength (1200–1700 Å) late time spectra of ONe novae observed at high resolution with IUE and HST (GHRS and STIS); time after maximum is noted. See Sect. 4 for discussion. Note that the designation of epoch for Nova Mon 2012 in both figures is relative to the Fermi/LAT observation and not the visual maximum.
Current usage metrics show cumulative count of Article Views (full-text article views including HTML views, PDF and ePub downloads, according to the available data) and Abstracts Views on Vision4Press platform.
Data correspond to usage on the plateform after 2015. The current usage metrics is available 48-96 hours after online publication and is updated daily on week days.
Initial download of the metrics may take a while.