Fig. 8
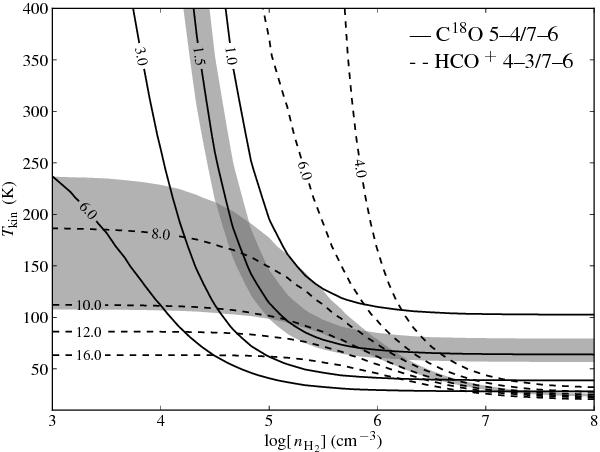
Lines of constant intensity ratio of C18O 5–4/7–6 (solid lines) and HCO+ 4–3/7–6 (dashed lines), resulting from a radex grid calculation. Curves are labeled by their line ratio value. The gray areas mark the 1-σ uncertainty ranges of the observed line intensity ratios in the outflow component, including the fit error (see Table 2) and the 10% calibration uncertainty (see Sect. 2.1). The darker gray area denotes the region where the observed line intensity ratios of both tracers overlap.
Current usage metrics show cumulative count of Article Views (full-text article views including HTML views, PDF and ePub downloads, according to the available data) and Abstracts Views on Vision4Press platform.
Data correspond to usage on the plateform after 2015. The current usage metrics is available 48-96 hours after online publication and is updated daily on week days.
Initial download of the metrics may take a while.