Fig. 4
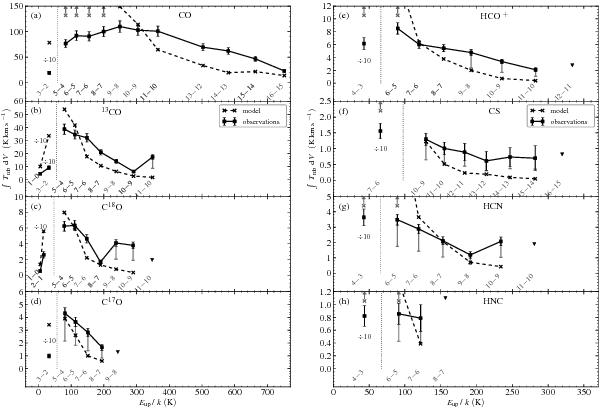
Spectral line energy distributions of CO a); its isotopic variants (b), c), d)); HCO+e); CS f); HCN g) and HNC h), as a function of Eup. Error bars on the observations (in black) represent the quadratic sum of the absolute intensity calibration uncertainty and the formal error on the Gaussian fit. Observed intensities represent only the envelope component for those lines fitted with a double Gaussian profile (Table 2). Since the intensity for a line fit by a single Gaussian is likely to be contaminated by outflow contribution as well, gray error bars provide an indication of the line intensity when up to half of the total line strength is attributed to the outflow. Downward pointing triangles indicate upper limits for undetected lines (see text in Sect. 3.1). Integrated line intensity values from the spherical model are marked by crosses and connected by dashed lines. Intensities from ground-based observations (J = 1–0, 2–1 and 3–2 for CO species, lowest transitions shown for HCO+, CS, HCN and HNC) and the corresponding model points (left of the dotted vertical line) are scaled down by a factor 10, as indicated by the “ ÷ 10” labels. Gray crosses accompanied by upward pointing arrows denote cases where the modeled line intensity falls off the vertical scale.
Current usage metrics show cumulative count of Article Views (full-text article views including HTML views, PDF and ePub downloads, according to the available data) and Abstracts Views on Vision4Press platform.
Data correspond to usage on the plateform after 2015. The current usage metrics is available 48-96 hours after online publication and is updated daily on week days.
Initial download of the metrics may take a while.