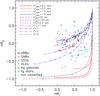
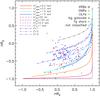
Fig. 3
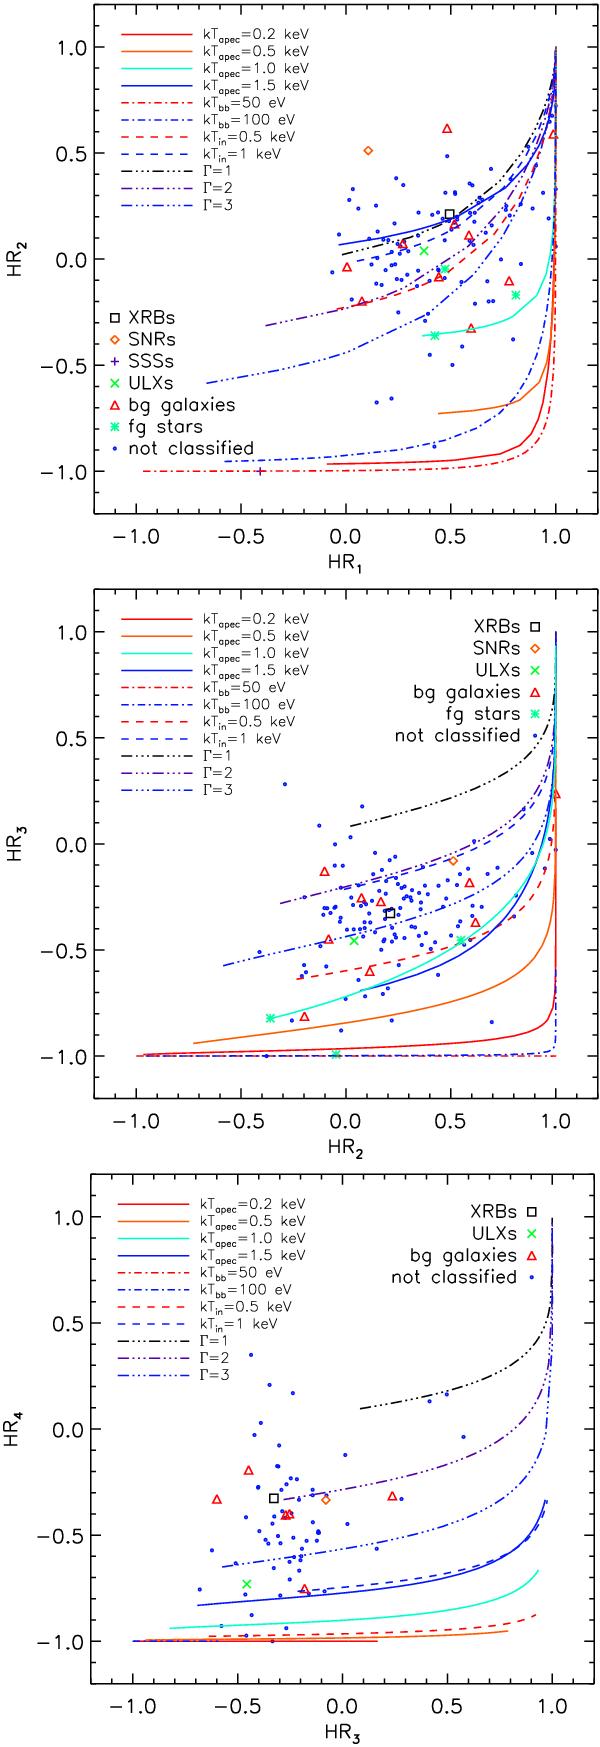
Hardness-ratio diagrams of sources with error-bars smaller than 0.3. Black squares are sources classified as XRBs (Sect. 5.4), orange diamonds are SNRs (Sect. 5.5), violet plus signs are SSSs (Sect. 5.6), green crosses are ULXs (Sect. 5.8), cyan stars are foreground stars (Sect. 5.1), red triangles are background sources (Sect. 5.2), and blue circles are sources not classified. The lines are the hardness ratios calculated for different spectral models and column densities, as described in Sect. 4.3.
Current usage metrics show cumulative count of Article Views (full-text article views including HTML views, PDF and ePub downloads, according to the available data) and Abstracts Views on Vision4Press platform.
Data correspond to usage on the plateform after 2015. The current usage metrics is available 48-96 hours after online publication and is updated daily on week days.
Initial download of the metrics may take a while.